Reports
Last updated: August 7, 2026
A Report is a dashboard made of charts you've pinned from Ask AI conversations. Instead of asking the same question every week, you pin the chart once and it keeps refreshing with your latest data.
You'll find Reports in the sidebar under Analytics, next to Ask AI. If you haven't read Ask AI yet, it's worth reading first, since every chart in a report starts life as an answer to a question there.
Your starter reports
When you connect an integration, Zaymo automatically builds you a few starter reports out of the box, for example:
Email, if Klaviyo is connected (email revenue, clicks, flow vs. campaign performance)
Revenue (net revenue, orders, repeat vs. new customer revenue)
Subscription health, if you're on Recharge or Skio (active subscribers, MRR, churn)
Retention
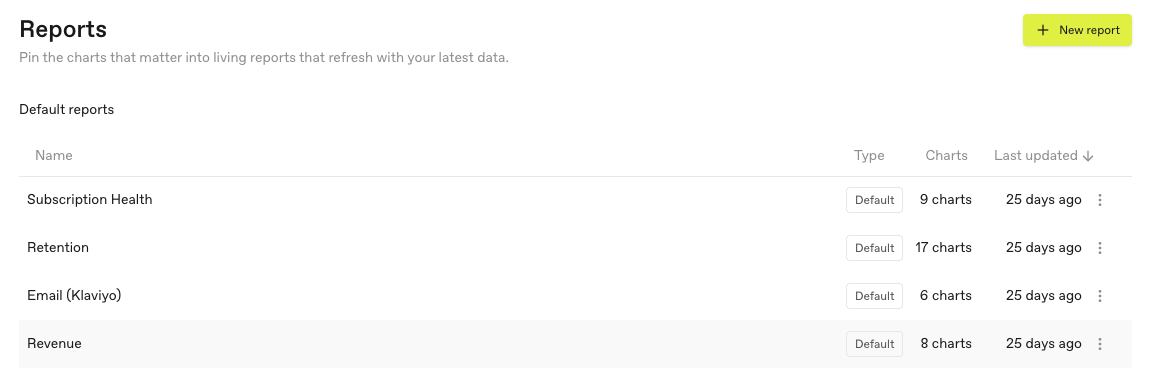
You don't need to build these yourself. They're a starting point, and you can add to them, rearrange them, or leave them alone.
Building your own report
The most common way to build a report is from a chat:
Ask a question in Ask AI that produces a chart.
On that chart, choose Pin this to a report.
Pick an existing report, or choose New report and give it a name.
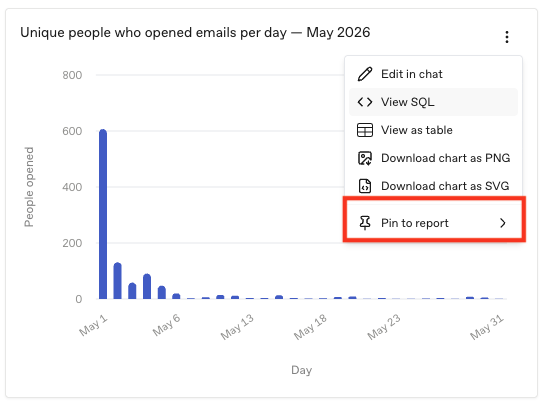
A chart can be pinned to more than one report, so the same chart can live on both a general Revenue report and a report you built for a specific campaign.
Arranging your report
On the Reports page, you can drag any chart to reposition it, and resize it from the corner. Your layout is saved automatically, there's no separate save button.
To start a new chart directly from inside a report, use the New chart button, which opens Ask AI already linked to that report so anything you pin lands there automatically.
Editing a chart
Click the pencil icon on any chart to open it for editing. From here you can:
Change the chart type, or which fields it's plotting
Ask a built-in mini chat to adjust it for you, for example "make this weekly instead of daily"
See and edit the underlying query directly, if you're comfortable with that (entirely optional)
Every change creates a new version, and you can look back through Version history to see or restore an earlier version of the chart.
Copying a chart to another report
From a chart's menu, choose Copy to report to duplicate it onto a different report. The original stays exactly where it is, this only adds a copy.
Exporting a chart
From a chart's menu you can:
Download as PNG or SVG, useful for a slide deck or a doc
Show as table, to see the raw numbers instead of the chart
View SQL, to see the underlying query
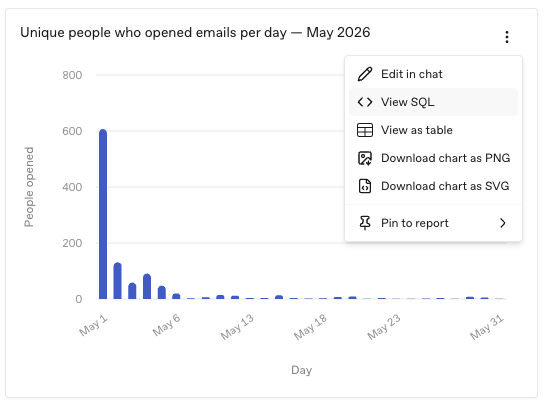
Image export isn't available for tables, heatmaps, funnels, or single stat tiles.
Removing charts and deleting reports
Use Remove from report on a chart's menu to take it off a report without deleting the chart itself elsewhere. To delete an entire report, use the delete option on the Reports page. This permanently deletes the report and every chart pinned to it, so it will ask you to confirm first.